Select Now
Home Updates Provider Announcements
Provider Announcements
New Feature Alert: Providers Dashboard with Monthly Earnings vs Finished Services Graph At Mifuto, we are constantly improving our platform to make managing your photography services easier and more insightful. We are excited to introduce a brand-new Providers Dashboard feature that helps you track your performance like never before. Monthly Earnings vs Finished Services Graph The highlight of this update is the Monthly Earnings vs Finished Services graph, designed to give you a clear visual overview of your business performance. Here’s how it helps: Track Your Earnings: Quickly see how much revenue you’ve generated each month. Monitor Completed Services: Visualize the number of services you’ve successfully delivered. Identify Trends: Spot peak months, evaluate slow periods, and make data-driven decisions to improve your workflow. Plan Ahead: Use insights from the graph to schedule your services effectively and maximize your earnings. Why It Matters This dashboard is a one-stop tool for providers to track their growth, manage their work efficiently, and understand how their efforts translate into earnings. The interactive graph ensures that you no longer have to rely on manual calculations or guesswork—everything is available at your fingertips. How to Access Log in to your Mifuto Provider Account. Navigate to the Dashboard section. View the Monthly Earnings vs Finished Services graph and explore your performance insights. At Mifuto, we aim to empower our providers with transparency, insights, and tools to succeed in their photography business. This is just one of the many updates designed to make your experience seamless and productive. Start tracking your growth today!

New Feature Alert: Providers Dashboard with Monthly Earnings vs Finished Services Graph

At Mifuto, we are constantly improving our platform to make managing your photography services easier and more insightful. We are excited to introduce a brand-new Providers Dashboard feature that helps you track your performance like never before.

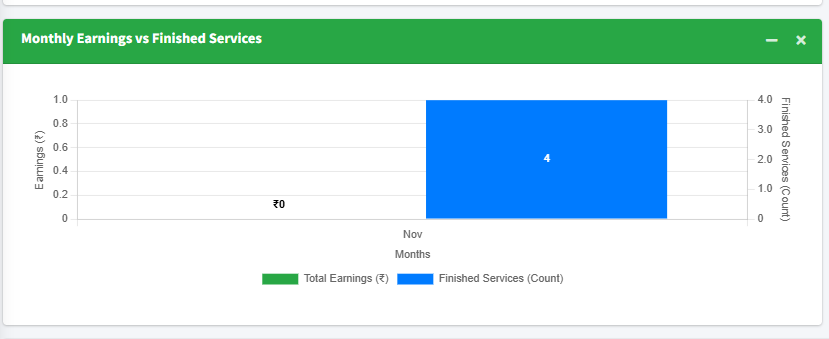
Monthly Earnings vs Finished Services Graph

The highlight of this update is the Monthly Earnings vs Finished Services graph, designed to give you a clear visual overview of your business performance. Here’s how it helps:

  • Track Your Earnings: Quickly see how much revenue you’ve generated each month.

  • Monitor Completed Services: Visualize the number of services you’ve successfully delivered.

  • Identify Trends: Spot peak months, evaluate slow periods, and make data-driven decisions to improve your workflow.

  • Plan Ahead: Use insights from the graph to schedule your services effectively and maximize your earnings.

Why It Matters

This dashboard is a one-stop tool for providers to track their growth, manage their work efficiently, and understand how their efforts translate into earnings. The interactive graph ensures that you no longer have to rely on manual calculations or guesswork—everything is available at your fingertips.

How to Access

  1. Log in to your Mifuto Provider Account.

  2. Navigate to the Dashboard section.

  3. View the Monthly Earnings vs Finished Services graph and explore your performance insights.

At Mifuto, we aim to empower our providers with transparency, insights, and tools to succeed in their photography business. This is just one of the many updates designed to make your experience seamless and productive.

Start tracking your growth today!

By PRIYANKA S
Tags
Event and wedding photographer dashboard Mifuto Providers Dashboard Photography business analytics Track photography earnings Freelance photographer tools Monthly earnings graph for photographers Manage photography services Photography business insights
MIFUTO

Capture Your Best Moments

Professional photography services for events, weddings and corporate coverage.

Book Services Now